Book Appointment Now
END-TO-END ETL PROJECT
If you’re passionate about data, you don’t just clean it ; you explore it, structure it, automate it, and try to make it speak. That was my goal with this project. I worked with Germany’s energy load and renewable generation data to build a complete, scalable pipeline — from raw CSVs to interactive dashboards, with automation and even some early machine learning exploration.
Getting the Data in Shape
The source was a large CSV file covering European energy statistics. I focused on Germany and used Python with Pandas for this phase. It gave me the flexibility to clean and restructure the dataset with ease, especially when working with dates and time-based values.
Tasks in this step included:
-
Filtering to isolate German data
-
Splitting the dataset into renewable generation and forecast & actual load files
-
Creating additional features like hour, weekday, and month
-
Renaming and formatting columns for clarity
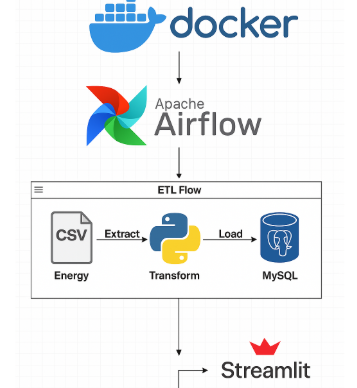
After the data was cleaned, I stored it in a MySQL database. I MySQL chose because it integrates well with other tools and provides a reliable foundation for automation and dashboarding.
Automating the Workflow
Once the data was structured and stored, I needed a way to automate the pipeline. Manual scripts weren’t sustainable — I wanted this to run on its own.
That’s why I used Apache Airflow. It allowed me to define tasks in a clear workflow: loading data, transforming it, and updating the database, all on schedule.
To make the system stable and consistent across devices, I introduced Docker at this stage. Using Docker Compose, I created containers for:
-
Airflow
-
MySQL
-
Python (for running scripts and transformations)
With this setup, I could launch the entire environment quickly and avoid compatibility issues. It also made it easier to share or deploy the pipeline elsewhere. I added the notification feature to send me an email in case anything fails.
**This step is especially ideal for dynamic data, where updates are frequent**
Turning Data into Insights
With the data flowing cleanly into MySQL, I connected it to Power BI to build a dashboard that could present key energy insights.
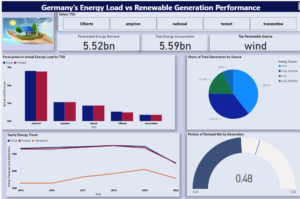
Some of the trends the dashboard helped reveal:
-
Germany’s actual energy consumption slightly exceeded the forecasted demand
-
Wind was the leading renewable energy source across the years
-
About 48 percent of the country’s energy demand was met through renewable generation
-
Between 2015 and 2020, the forecast and actual values stayed closely aligned.
The dashboard also features filters for selecting different transmission operators and allows interactive exploration of the yearly trend, source shares, and performance gaps.
Going One Step Further
Even though it wasn’t part of the automated pipeline, I wanted to explore how far I could take the structured data.
I trained a simple regression model using Scikit-Learn to predict actual load based on forecast values and time-related features. To make the model accessible, I created a small FastAPI service to host it, and a clean Streamlit interface to try it out.
This part was purely experimental, but it showed how the project could grow in the future — from data cleaning and automation to live forecasting and user interaction.
Final Takeaways
This project helped me bring together multiple skills , data wrangling, database management, workflow automation, dashboarding, and even model deployment.
By the end, I had:
-
A working and reusable ETL pipeline
-
Task orchestration with Airflow, packaged in Docker
-
A connected Power BI dashboard with meaningful insights
-
A working ML demo, ready for future extension
The full code, structure, and walkthrough are available on GitHub: